


SAT Mean, Median, Range, Standard Deviation
Mean, Median, Range & Standard Deviation
A detailed SAT-focused lesson for understanding center and spread, recognizing the right statistic, solving efficiently, and interpreting data from lists, tables, dot plots, and real-world contexts.
The Big Picture: Center vs. Spread
Start by asking what the statistic is designed to describe.
Where is the data located?
Mean is the arithmetic average. Median is the middle position after ordering.
How much do the values vary?
Range measures the full distance from minimum to maximum. Standard deviation describes typical spread around the mean.
Mean: The Balance Point
The mean uses every observation.
Add every value, then divide by the number of values.
Example: \(18,22,25,27,28\)
Reverse the formula
If the mean of 6 values is 14, the total is:
This is the key to missing-value questions.
Fast balancing
For \(48,49,50,51,52\), the values balance around \(50\). Therefore the mean is \(50\) without lengthy addition.
The mean of 5 numbers is \(18\). Four numbers are \(11,15,19,23\). What is the fifth?
Show solution
Required total: \(5*(18)=90\).
Known total: \(68\).
Missing value: \(90-68=\boxed{22}\).
Median: The Middle Position
Order first. Then find the middle.
Example: \(3,8,5,11,6,4,9\)
For \(4,7,9,12,15,18\), what is the median?
Show solution
The middle values are 9 and 12.
Thus \((9+12)/2=\boxed{10.5}\).
Range: The Overall Width
Range uses only the two extremes.
What range notices
Only the minimum and maximum. Everything between them is ignored.
What range misses
It cannot tell you whether most values are tightly clustered or widely separated between the endpoints.
A data set has minimum 18 and maximum 46. If the maximum becomes 51, how does the range change?
Show solution
Old range: \(46-18=28\).
New range: \(51-18=33\).
It increases by \(\boxed{5}\).
Standard Deviation: Spread Around the Mean
Interpret the spread; do not turn the SAT question into a long calculation.
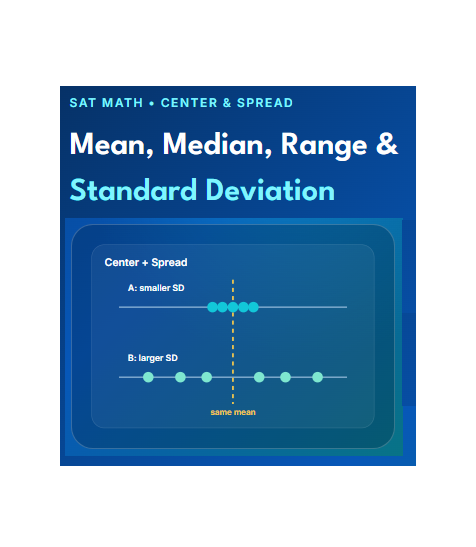
Standard deviation summarizes how much the observations tend to vary from the mean.
A smaller standard deviation means the observations tend to stay closer to the mean.
Dataset A
Mean = 50. Values stay close.
Dataset B
Mean = 50. Values are much farther away.
Two neighborhoods have the same mean house price. A has SD \(\$20{,}000\); B has SD \(\$60{,}000\). Which is supported?
Show solution
The means are equal. A has the smaller SD, so A’s prices are more tightly clustered around its mean.
Standard Deviation from Dot Plots
A visual spread question can often be solved without calculating SD.
The dot plots show quiz scores for two classes of 24 students each. Which statement is true?
Show solution
Class A is tightly clustered; Class B is more spread out. Therefore Class A has the smaller standard deviation.
Outliers and Their Effects
An extreme observation can affect different statistics in different ways.
Mean
Uses every value, so an extreme value can pull the mean toward itself.
Median
Uses position, so an extreme value often has much less effect on it.
A data set is \(8,9,10,11,12\). A new value of \(60\) is added. Which statement is most reasonable?
Show solution
Compare Data Sets: Center + Spread
The SAT often combines several statistics in one interpretation question.
| Statistic | What it tells you | Fast clue |
|---|---|---|
| Mean | Arithmetic center | sum ÷ count |
| Median | Middle position | order first |
| Range | Full width | max − min |
| Standard deviation | Typical spread around mean | larger SD = more spread |
Two data sets have the same mean. Set P has SD \(3\); Set Q has SD \(9\). Which must be true?
Show solution
Equal means establish equal centers. The smaller SD establishes less spread around the mean.
Transformations: What Changes and What Stays?
Adding to every value shifts location but does not change distances between values.
| Change every value | Mean | Median | Range | SD |
|---|---|---|---|---|
| Add \(c\) | + \(c\) | + \(c\) | unchanged | unchanged |
| Subtract \(c\) | − \(c\) | − \(c\) | unchanged | unchanged |
| Multiply by positive \(c\) | × \(c\) | × \(c\) | × \(c\) | × \(c\) |
A data set has mean \(37\), range \(18\), and SD \(4\). Every value increases by \(6\). What are the new values of these three statistics?
Show solution
Mean shifts: \(37+6=43\).
Range and SD are unchanged.
Answer: B.
Reverse-Mean Questions
Turn a mean into a total, then work backward.
The one formula to remember
Then subtract known values or old totals as needed.
The mean of 8 values is \(15\). A ninth value is added, and the new mean is \(17\). What is the added value?
Show solution
The mean of 10 values is \(42\). One value is removed, and the mean of the remaining 9 values is \(40\). What was removed?
Show solution
Original total: \(10*(42)=420\).
Remaining total: \(9*(40)=360\).
Removed value: \(420-360=\boxed{60}\).
Real-World Interpretation
The context changes; the statistical reasoning does not.
A town’s homes have mean sale price \(\$410{,}000\) and median sale price \(\$360{,}000\). Which statement is most consistent?
Show solution
A mean above the median can occur when high observations pull the mean upward. The other claims require information not given.
Practice: Mixed SAT Center & Spread
Now combine the ideas instead of treating each statistic in isolation.
The mean of 6 numbers is 24. What is their sum?
Solution
What is the median of \(4,9,6,12,7,10,5\)?
Solution
The minimum and maximum are 13 and 47. What is the range?
Solution
Two data sets have the same mean. P has SD \(2.5\), Q has SD \(7.5\). Which is more tightly clustered?
Solution
The mean is 31. Every value decreases by 8. What is the new mean?
Solution
Two data sets have equal means. A has smaller range and smaller SD than B. Which is supported?
Solution
A data set has median 25 and mean 31. Which could help explain the difference?
Solution
The mean of 4 numbers is 19. Three are \(12,17,21\). What is the fourth?
Solution
SAT Data Analysis — Advanced Practice
Original SAT-style problems built around the kinds of statistical reasoning students are expected to recognize, interpret, and solve under test conditions.
How to use this practice set
Each problem begins with the kind of visual information you may encounter on the SAT: a histogram, a table, a distribution, or a frequency display. Before calculating anything, first ask: What is the question really asking me to compare or determine?
Try each question on your own first. Then use the solution to study the reasoning, not just the answer. The goal is to recognize the underlying idea quickly when the SAT presents it in a different context.
Read a Histogram → Estimate the Mean
Use the distribution to estimate a measure of center.
- A) 4.5
- B) 6.5
- C) 7.5
- D) 9.5
Step-by-step solution
Find the midpoint of each interval. The representative values are 1, 4, 7, 10, and 13.
Multiply each representative value by its frequency:
Add the products:
There are 20 students, so divide the approximate total by 20:
The estimate is about 7 books. Among the choices, 6.5 is the closest.
Outliers → Mean, Median & Range
Understand how an unusually large value changes statistics.
18, 20, 21, 22, 23, 24, 25, 26, 27, 28, 91
The value 91 is considered an outlier. If the value 91 is removed, which statement is true?
- A) The mean decreases, the median decreases, and the range decreases.
- B) The mean decreases, the median stays the same, and the range decreases.
- C) The mean stays the same, the median decreases, and the range decreases.
- D) The mean decreases, the median stays the same, and the range stays the same.
Step-by-step solution
Start with the mean. The value 91 is much larger than the other values, so it pulls the mean upward. Removing 91 therefore makes the mean decrease.
There are 11 values, so the median is the 6th value:
After removing 91, there are 10 values. The two middle values are 23 and 24:
Originally, the range is:
After removing 91:
Add an Outlier → Which Measure Changes Most?
Compare the effects of an extreme observation.
A new observation of 100 minutes is added. Which measure is affected the most?
- A) Mean
- B) Median
- C) Range
- D) Median and range equally
Step-by-step solution
The original data are:
Find the original mean:
After adding 100, the new mean is:
The mean increases by:
The original median is the middle value:
With 100 added, there are 8 values. The two middle values are 32 and 34:
So the median increases by only:
Now compare the ranges.
The range increases by:
Compare the changes: the mean changes by 8.5, the median changes by 1, and the range changes by 60.
Rate of Change from a Data Table
Distinguish total change from average change per interval.
| Year | Annual spending |
|---|---|
| 2021 | $2,400,000 |
| 2022 | $2,550,000 |
| 2023 | $2,760,000 |
| 2024 | $2,970,000 |
- A) $150,000
- B) $190,000
- C) $200,000
- D) $570,000
Step-by-step solution
Find the total increase from 2021 to 2024:
From 2021 to 2024 there are three one-year intervals: 2021→2022, 2022→2023, and 2023→2024.
Divide the total increase by 3:
Target Average → Find the Missing Value
Work backward from a required mean.
| Quiz 1 | Quiz 2 | Quiz 3 | Quiz 4 | Quiz 5 | Quiz 6 |
|---|---|---|---|---|---|
| 72 | 81 | 84 | 88 | 90 | ? |
72, 81, 84, 88, 90
What is the minimum score the student must earn on the sixth quiz to have an average score of at least 85?
- A) 92
- B) 93
- C) 94
- D) 95
Step-by-step solution
Add the five existing scores:
Let the sixth score be x. The desired average is at least 85:
Multiply both sides by 6:
Subtract 415:
Therefore, the smallest possible score is 95.
Combined Mean from Two Groups
Combine group means using group sizes.
Group A
80 birds
Mean wingspan: 31 cm
Group B
120 birds
Mean wingspan: 34 cm
- A) 32.2 cm
- B) 32.8 cm
- C) 33.0 cm
- D) 33.5 cm
Step-by-step solution
Convert Group A’s mean into its total wingspan:
Convert Group B’s mean into its total wingspan:
Add the two totals:
Divide by the total number of birds:
Add a Value → What Happens to Mean and Median?
Separate the effects on center measures.
The visual represents all 50 observations; repeated values are shown as vertical stacks.
Which statement must be true?
- A) The new mean is greater than 49, and the new median is greater than 52.
- B) The new mean is greater than 49, but the new median is 52.
- C) The new mean is 49, and the new median is greater than 52.
- D) Both the new mean and the new median are greater than their original values.
Step-by-step solution
Consider the mean first. The original mean is 49, while the added value is 90.
Adding a value larger than the current mean pulls the mean upward. Therefore, the new mean must be greater than 49.
There are initially 50 values. Because the 25th and 26th values are both 52, the original median is 52.
After adding 90, there are 51 values. Since 90 is larger than every original value, it is placed at the end of the ordered data. The new median is therefore the 26th value, which was already 52.
Sample Data → Population Interpretation
Use a random sample to estimate a larger population.
| Number of siblings | School A Sample |
School B Sample |
|---|---|---|
| 0 | 82 | 110 |
| 1 | 66 | 52 |
| 2 | 32 | 24 |
| 3 | 14 | 10 |
| 4 | 6 | 4 |
A random sample of 200 students was selected from each school. School A has 2,000 students and School B has 3,000 students.
- A) Exactly 820 students at School A have no siblings.
- B) Approximately 820 students at School A have no siblings.
- C) Exactly 1,100 students at School A have no siblings.
- D) Approximately 1,100 students at School A have no siblings.
Step-by-step solution
In the sample, 82 of the 200 students reported having zero siblings.
So approximately 41% of the students in the school would be expected to have zero siblings.
School A has 2,000 students:
Because the 200 students were a sample rather than every student in the school, the result is an estimate.
Median from a Frequency Table
Locate the middle observations using cumulative frequency.
| Number of siblings | Number of students |
|---|---|
| 0 | 12 |
| 1 | 18 |
| 2 | 16 |
| 3 | 9 |
| 4 | 5 |
- A) 1
- B) 1.5
- C) 2
- D) 2.5
Step-by-step solution
There are 60 students. Because 60 is even, the median is the average of the 30th and 31st values.
Build cumulative frequencies:
| Siblings | Frequency | Cumulative frequency |
|---|---|---|
| 0 | 12 | 12 |
| 1 | 18 | 30 |
| 2 | 16 | 46 |
| 3 | 9 | 55 |
| 4 | 5 | 60 |
The cumulative frequency reaches 30 at a sibling count of 1. Therefore, the 30th value is 1.
The 31st observation belongs to the next row. Therefore, the 31st value is 2.